Has the Rise in Music Streaming Made Songs Shorter?
Joe Henry-Penrose
Introduction:
Lil Nas X’s hit “Old Town Road” took global charts by storm in April and May of 2019. Immediately, the song struck me as interesting—it’s by an unknown artist, Lil Nas X bought the beat from someone he’d never met, and to top it off there was a massive fiasco surrounding the song’s status as country or rap. The most interesting thing is the structure and how short the song is. “Old Town Road” ends with only one run through of its incredibly catchy chorus, rather than following most pop songs and their incessant repetition. Listeners don’t get the full satisfaction of listening to the song once, they need to stream it again to get their shot of yeehaw.
Tierra Whack's Whack World also showed this shift to shorter songs through its medium. Whack shared the audio/visual album through Instagram, with each song lasting only 90 seconds. Projects such as these push the boundries of art within technology and beg the question of what effect medium has on art. Further, this has caused many to question if our attention spans for media has decreased.
While this may be due to the young rapper trying something new, this also signals a shift in the recording industry to a streaming-first mentality. According to Spotify, a stream is counted as playing a song for over 30 seconds. In terms of “Old Town Road,” this means that there will be more plays due to this need to hear the song for a second time. This is helped by the song’s short duration—1:53 for the original and 2:37 for Billy Ray Cyrus’s remix—and by having two versions of the song.
Spotify’s 30-second steaming definition also points towards an overall shift to shorter songs. If nine and 12-minute songs are paid the same amount as a one minute song, why would labels pay for long songs that make them less money? Ethics aside, I wanted to search and see if this was true; has a rise in streaming resulted in a reduction in song durations for the Billboard Top 100? Further, does this differ for number one songs and by genre?
My Hypothesis: There is an inverse correlation between the number of subscribers for on-demand music streaming services and song durations in the Billboard Top 100 chart.
Importing & Cleaning Data:
I used Michael Tauberg’s dataset of the Billboard Top 100 from 1/1/2005 to 12/13/2017. This data included the top 100 for each week as well as all Spotify data and lyrics for each song. The data and files used to gather it can be found here.
For streaming data, I reformatted a Statistica dataset on the RIAA's global music industry revenue data from 2008 to 2018. This data shows the economic growth in streaming and is more compelling than the number of subscribers alone. The data can be downloaded via statistica here.
Alternatively, download the two cleaned CSV files here and my Rproj file here.
Code To Import & Clean Data:
library(tidyverse)
library(tidytext)
install.packages("devtools")
library(devtools)
devtools::install_github('charlie86/spotifyr')
install.packages('spotifyr')
library(spotifyr)
Sys.setenv(SPOTIFY_CLIENT_ID = “YOURCLIENTIDHERE”)
Sys.setenv(SPOTIFY_CLIENT_SECRET = “YOURCLIENTSECRETHERE”)
access_token <- get_spotify_access_token()
devtools::install_github("josiahparry/genius")
library(genius)
library(knitr)
install.packages("ggplot2")
library(ggplot2)
library(dplyr)
install.packages("tm")
library(tm)
install.packages("data.table")
library(data.table)
install.packages("dplyr")
library(dplyr)
install.packages("doBy")
library(doBy)
#reading streaming revenue data from pre-cleaned (mostly) CSV
musicRev <- read.csv(file="global_music_revenue_2008-2018.csv", header=TRUE, sep=",")
#Reformatting the streaming numbers and removing commas.
streamingRev <- streamingRev %>% na.omit(streamingRev)
streamingRev$Subscription.and.streaming = as.character(streamingRev$Subscription.and.streaming)
streamingRev$Subscription.and.streaming <- as.numeric(gsub(",","",streamingRev$Subscription.and.streaming))
streamingRev$Subs.stream.b <- streamingRev$Subscription.and.streaming/1000
#Reading in billboard data. Very not clean and must be made numeric.
MTBillboard <- read.csv(file="songs_18yrs_spotify_data_v5.csv", header=TRUE, sep=",")
MTBillboard$num_words_in_song_title = sapply(gregexpr("\\S+", MTBillboard$title), length)
MTBillboard$num_words_in_song = sapply(gregexpr("\\S+", MTBillboard$lyrics), length)
MTBillboard$num_words_in_song_title = as.numeric(as.character(MTBillboard$num_words_in_song_title))
MTBillboard$num_words_in_song = as.numeric(as.character(MTBillboard$num_words_in_song))
MTBillboard$duration_ms = as.numeric(as.character(MTBillboard$duration_ms))
MTBillboard$danceability = as.numeric(as.character(MTBillboard$danceability))
MTBillboard$valence = as.numeric(as.character(MTBillboard$valence))
MTBillboard$energy = as.numeric(as.character(MTBillboard$energy))
MTBillboard$tempo = as.numeric(as.character(MTBillboard$tempo))
MTBillboard$duration = MTBillboard$duration_ms/1000/60
MTBillboardNumOne <- MTBillboard %>% filter(peak_pos == 1)
MTBillboardHotShot <- MTBillboard %>% filter(change == "Hot Shot Debut")
#Creating data frame of the mean duration of only number one songs by year
boardNumOneByYear <- as.data.frame(aggregate(MTBillboardNumOne$duration,list(Year = MTBillboardNumOne$year), mean))
colnames(boardNumOneByYear)[colnames(boardNumOneByYear)=="x"] <- "avg_duration_mins"
#Average duration of hot shot songs by year
boardHotShotByYearTest<- aggregate(duration~year, MTBillboard, mean)
boardHotShotByYear <- as.data.frame(aggregate(MTBillboardHotShot$duration,list(Year = MTBillboardHotShot$year), mean))
colnames(boardHotShotByYear)[colnames(boardHotShotByYear)=="x"] <- "avg_duration_mins"
#Average duration of all songs by year and genre
boardByYearTest<- aggregate(duration~year, MTBillboard, mean)
colnames(boardByYear)[colnames(boardByYear)=="x"] <- "avg_duration_mins"
#Dataframe of average song duration by year and genre
boardByYearandGenre<- aggregate(duration~year+broad_genre, MTBillboard, mean)
Tauberg's CSV file is not read as numerical data by R, so this code just switches each column to numeric and character data. It also adds a few other columns that have readouts for the duration in minutes and more. Finally, it also creates several new dataframes containing the durations for all Number One songs and Hot Shot Debut songs.
3:30?
Back in 2017, Durham locals Sylvan Esso released "Radio," a biting single that takes shots at the music industry for wanting short singles that are three-and-a-half minutes in length and only wanted to play a certain number of female vocalists. This claim of 3:30 struck me as odd once I started to look into this dataset, so I started off by putting it to the test.
ggplot(MTBillboard, aes(x=date, y=duration, color = peak_pos)) +
geom_point() +
geom_hline(yintercept = 3.5, size = 1, colour="#A20021") +
theme(axis.text.x = element_blank(), axis.ticks = element_blank()) +
ylab("Average Duration (Minutes)") +
xlab("Time (2000 to 2017)") +
labs(color = "Peak Position
on Billboard
Chart", title = "Were Sylvan Esso Right?",
subtitle = 'Are we a slave to the three-and-a-half minute single as they claim in their hit song "Radio?"
Source: Billboard Top 100 years 2000 to 2017
The red line represents 3:30')
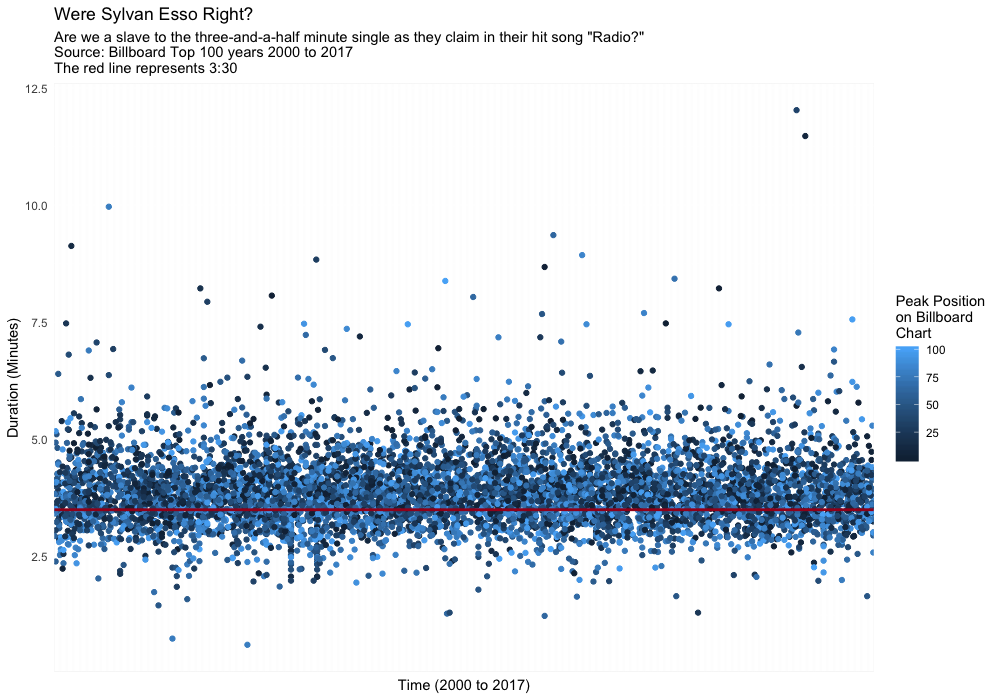
They were not right. Most Billboard Top 100 songs average around 4:30. Radio is a great track though. Sorry Nick.
Song Durations
After indulging my curiosity, we can now look into actual data by year in detail. Creating these three plots should help to see how song durations have changed. I mapped the average song duration in minutes by year as well as the amount of revenue ASCAP reported from subscriptions and streaming in USD Billions.
#Bar chart of change in average duration of number 1 songs on billboard 100
avgDurNumOne <- ggplot(boardNumOneByYear, aes(x=Year, y=avg_duration_mins)) +
geom_bar(stat = "identity", position="identity", fill="#175676") +
theme_minimal() +
geom_hline(yintercept = 0, size = 1, colour="#333333") +
ylab("Average Duration (Minutes)") +
labs(title="Average Song Duration For Billboard Number Ones",
subtitle = "Songs number one for at least one week between 1/1/2005 and 12/31/2017
The red line indicates global reported streaming revenue in USD billions (Source: ASCAP and Statista)") +
geom_line(data=streamingRev, aes(x=Year, y=Subs.stream.b), size=1 , colour="#A20021")
#Bar chart of change in average duration of Hot Shot songs on billboard 100
avgDurHotShot <- ggplot(boardHotShotByYearTest, aes(x=year, y=duration)) +
geom_bar(stat = "identity", position="identity", fill="#175676") +
theme_minimal() +
geom_hline(yintercept = 0, size = 1, colour="#333333") +
ylab("Average Duration (Minutes)") +
labs(title="Average Song Duration For Billboard Hot Shot Songs",
subtitle = "Songs debuting with 'Hot Shot' status for at least one week between 1/1/2005 and 12/31/2017
The red line indicates global reported streaming revenue in USD billions (Source: ASCAP and Statista)") +
geom_line(data=streamingRev, aes(x=Year, y=Subs.stream.b), size=1 , colour="#A20021")
#Bar chart of change in average duration of all songs on billboard 100
avgDur <- ggplot(boardByYearTest, aes(x=date, y=duration)) +
geom_bar(stat = "identity", position="identity", fill="#175676") +
theme_minimal() +
geom_hline(yintercept = 0, size = 1, colour="#333333") +
ylab("Average Duration (Minutes)") +
labs(title="Average Song Duration For Billboard Songs",
subtitle = "Songs ranking in the top 100 for at least one week between 1/1/2005 and 12/31/2017
The red line indicates global reported streaming revenue in USD billions (Source: ASCAP and Statista)") +
geom_line(data=streamingRev, aes(x=Year, y=Subs.stream.b), size=1 , colour="#A20021")
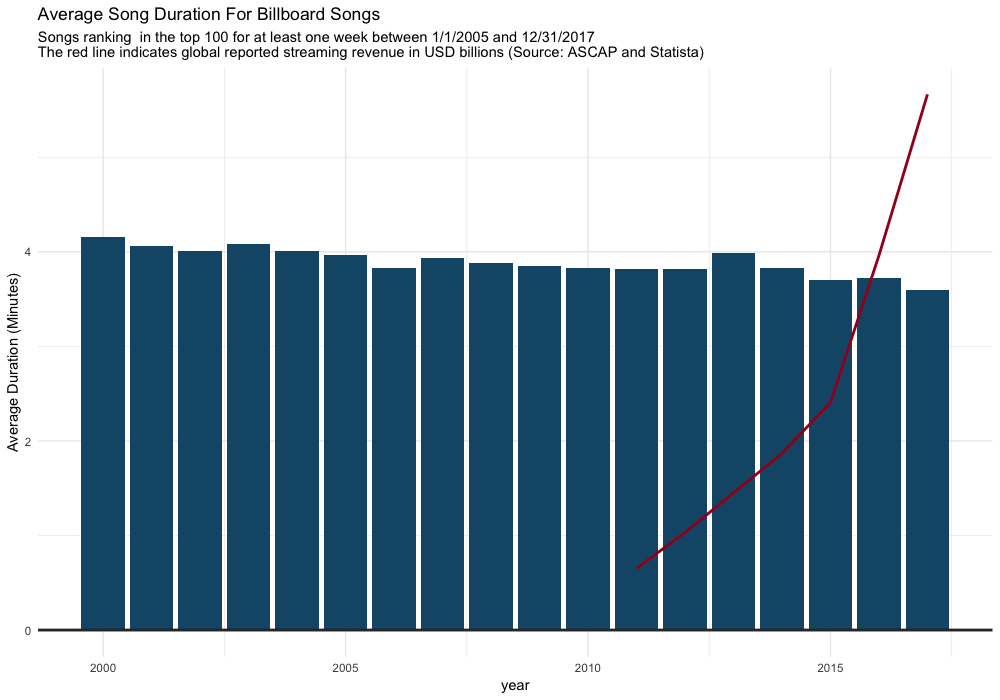
Mean duration of songs in the Billboard Top 100 for years 2000 to 2017 compared with the rise in streaming revenue, reported by ASCAP.
From this alone, we can see that popular songs have become shorter and that this corrolates with the rise of streaming. Interestingly, the trend of songs shortening starts well before streaming rose in popularity. However, the decrease in average duration does seem to heighten as streaming skyrockets as a source of revenue.
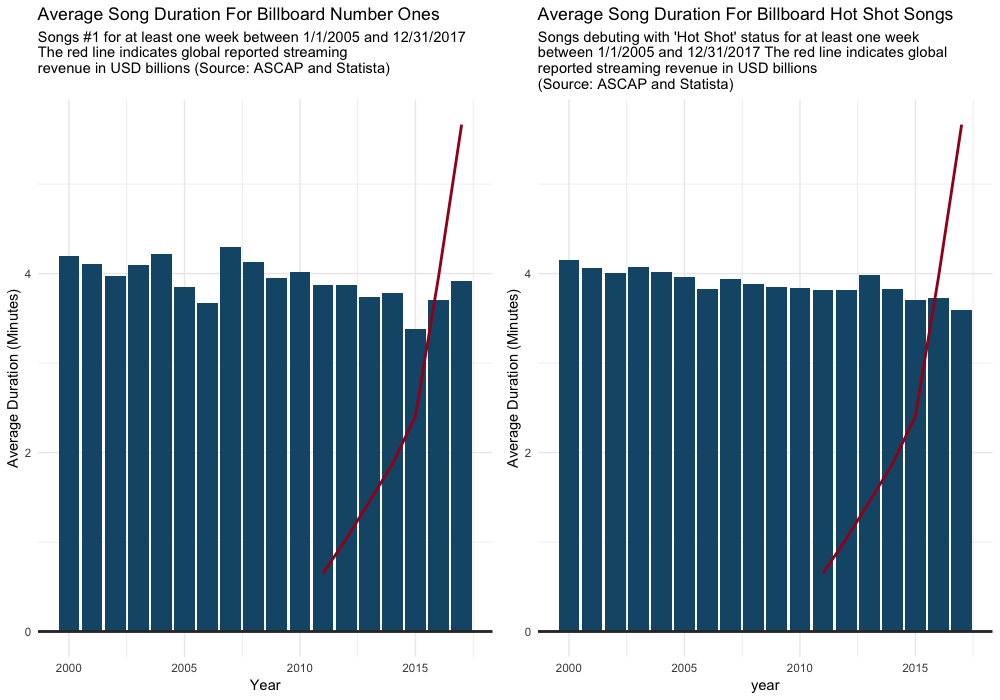
Mean duration of songs in the Billboard Top 100 that are either Hot Shot Debuts or Number One songs for at least one week for years 2000 to 2017 compared with the rise in streaming revenue, reported by ASCAP.
This trend is heightened for "Hot Shot Debuts," with these songs shrinking drastically in duration year-to-year. While there is no concrete definition listed by Billboard, it appears that Hot Shot Debut songs are songs that debut highly on the Billboard Top 100.
Curiously, after almost 15 years of overall declines in the duration of number one songs, number ones are beginning to lengthen. This could be that people are more willing to give attention and time to trusted names such as Drake and Ed Sheeran, but less to unknown, lower artists. With Lil Nas X's several weeks at number one, it will be interesting to compare this to 2019's data.
Comparing Change In Duration By Genre and Year
We now know definitvely that songs are shortening in duration. But how does each genre compare? While each song on the Billboard Top 100 has several genres at once, our dataset has a "broad genre" declaration. Mapping this out in two ways will help to see the movement of each genre over time.
#Line plot of change in average song duration by year
ggplot(boardByYearandGenre, aes(x=year, y=duration, color=broad_genre)) +
geom_line(stat = "identity") +
geom_hline(yintercept = 0, size = 1, colour="#333333") +
theme_minimal() +
ylab("Average Duration (Minutes)") +
labs(title="Average Song Duration For Billboard Songs",
subtitle = "Songs ranking in the top 100 for at least one week between 1/1/2005 and 12/31/2017")
ggplot(boardByYearandGenre, aes(x=year, y=duration, color=broad_genre)) +
geom_smooth(method = "lm") +
geom_hline(yintercept = 0, size = 1, colour="#333333") +
theme_minimal() +
ylab("Average Duration (Minutes)") +
labs(title="Average Song Duration For Billboard Songs",
subtitle = "Songs ranking in the top 100 for at least one week between 1/1/2005 and 12/31/2017")
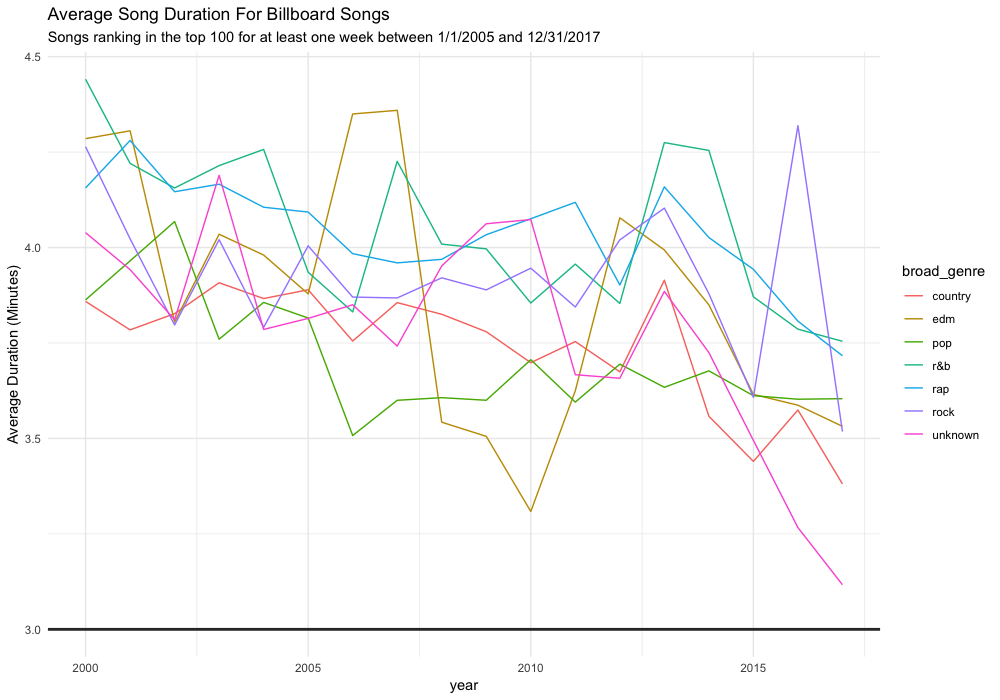
Mean duration of songs in the Billboard Top 100 sorted by broad genre and year.
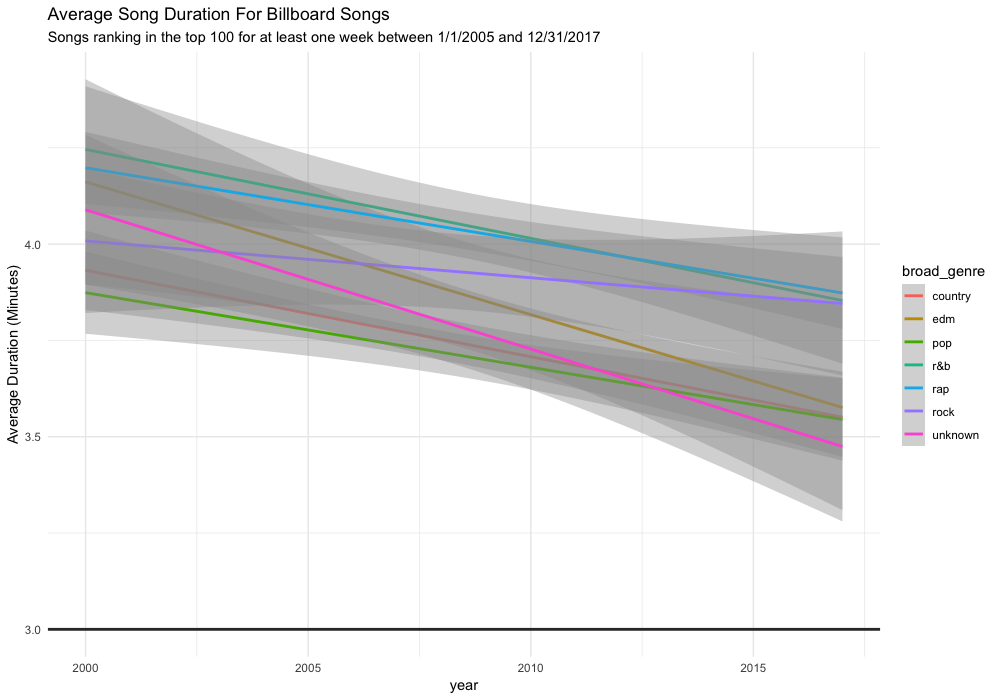
Mean duration of songs in the Billboard Top 100 sorted by broad genre and year, averaged.
While every genre has, on average, shortened in duration, rock has changed the least. EDM (electronic dance music) and "unknown" has changed the most, possibly meaning that these unknown songs are fresher sounding, without one main, obvious genre. Looking at the data, Unknown genre songs include Christmas tunes, songs by the human equivalent of a hangnail XXXTentacion, some show tunes, and others by artists like Bhad Bhabie (the "cash me outside" girl is a rapper now?). In short, a large amount of very new music as well as some more "fringe genres" such as ambient, show tunes, seasonal music, and more. This could be why Unknown dropped so dramatically because rap that pushes boundaries is placed in this category.
# Plots duration averages for each genre
#Interesting that country has the least variety and r&b has the longest song
avgDurGenre <- ggplot(data=MTBillboardNumOne, aes(x=broad_genre, y=duration, fill=broad_genre)) +
geom_boxplot() + #fill="#1F7AA8"
theme_minimal() +
ylab("Minutes") +
theme(legend.position = "none") +
labs(title="Average Duration of Songs For Billboard Songs",
subtitle = "Songs ranking in the top 100 for at least one week between 1/1/2005 and 12/31/2017")
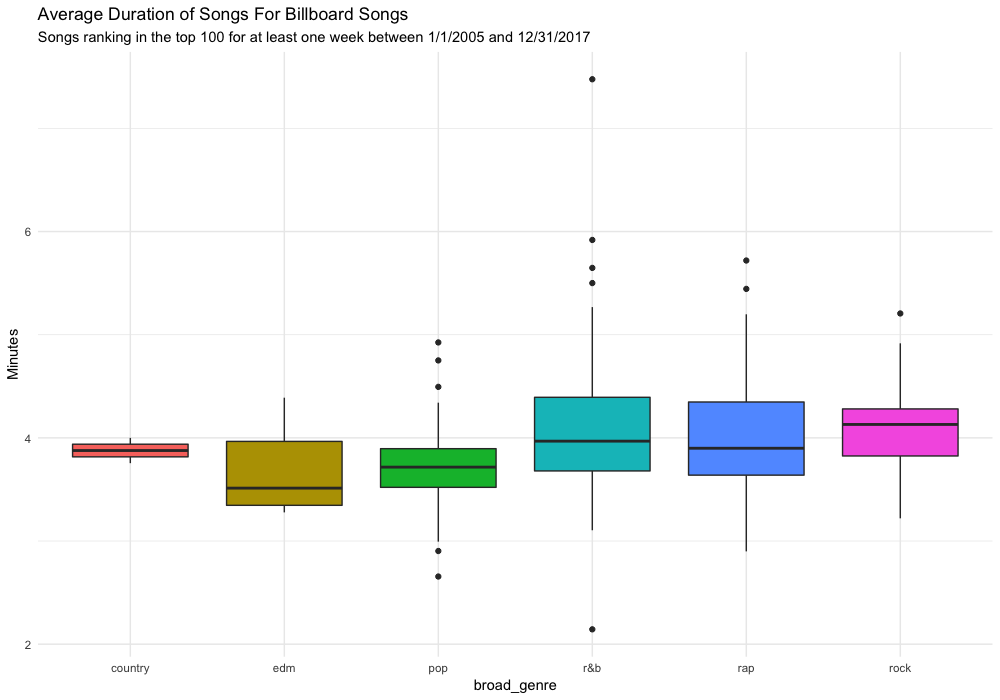
A boxplot showing the mean, median, and quartiles of duration for each genre.
Looking at a boxplot of durations by genre helps to provide context. Looking at the slope graph, we see that almost every genre apart from rock has decreased in duration at a fairly equal rate. Comparing this to the boxplot, we can see that certain genres have a much wider variety of lengths.
Conclusion:
Overall, it appears that my hypothesis has been proven correct; song durations in the Billboard Top 100 have decreased in an inverse corrolation with the revenue earned from music streaming. However, this does not necessarily mean that there is a corrolation. This change in duration could also be to do with technological shifts, a decrease in attention span, a shift in consumer media habits, and the artistic choices and trends within music. This does help to continue a conversation on how our media habits and mediums of consuming media affect the artists and industries that we love.
The average song length in the Billboard Top 100 decreased 13.578% from 2000 to 2017.
Since Karlheinz Brandenburg invented the MP3, music has declined in value dramatically. Without a similar disruption in consumer ethics and listening habits, I predict that popular songs will continue to decrease in duration and that labels will continue to focus more on addictive, short tracks that use the 30 second Spotify payout liberally.