Analyzing Kanye West Albums with Different Sentiment Scales
Antoinette Jakaitis
Let’s talk about Kanye West. West has changed the Hip-Hop world like no artist has ever done in the 21st Century, and he is undoubtedly one of the greatest Hip-Hop artists of all time. West's influence and legacy is unquestionable. He has released seven studio albums over a course of a little over a decade -
- The College Dropout (2004)
- Late Registration (2005)
- Graduation (2007)
- 808s & Heartbreak (2008)
- My Beautiful Dark Twisted Fantasy (2010)
- Yeezus (2013)
- The Life of Pablo (2016)
West's music has differed a lot from album to album. He has also changed a lot as a person, his public image becoming, in my opinion, increasingly manic and intense over time. Due to this, I hypothesized that his lyrics have become more negative with each album, including more emotions such as anger, disgust, fear and sadness.
Four of these albums are on Spotify (Graduation, My Beautiful Dark Twisted Fantasy, Yeezus, The Life of Pablo), each with increments of three years in between them, so these are the four I chose to analyze for this report. I wanted to use this report to explore the different results I could find by using the three difference sentiment scales: bing, afinn, and nrc. I used the "genuisR" package to download the full album lyrics from each album.
Album Sentiments using Bing
I began my analysis by using the bing sentiment scale to analyze the positive and negative words. After getting the lyrics with the geniusR package, then I unnested the tokens and removed stopwords. Next I inner joined the list of words with the bing sentiment scale. In order to count the number of positive words and the number of negative words in the album, I arranged the words by sentiment, then took the sum of all the negative words and all the positive words. I wanted to present these as percents, so I divided the number of words by the total number of words in the album. Last, I put this data into a new dataframe and plotted it in a pie chart showing the composition of positive and negative words in each album. I then repeated the process for each album. View my code below (only showing the code for Graduation):
Graduation <- genius_album(artist = "Kanye West", album = "Graduation")
MBDTF <- genius_album(artist = "Kanye West", album = "My Beautiful Dark Twisted Fantasy")
Yeezus <- genius_album(artist = "Kanye West", album = "Yeezus")
TLOP <- genius_album(artist = "Kanye West", album = "The Life of Pablo")
# unnest tokens and remove stopwords
GraduationWords <- Graduation %>% dplyr::select(lyric) %>% unnest_tokens(words, lyric)
rename(GraduationWords, c("words" = "word")) -> GraduationWords2
GraduationClean <- GraduationWords2 %>% anti_join(stop_words, by = c("word" = "word"))
# sentiment
GraduationSentBing <- GraduationOrdered %>% inner_join(get_sentiments("bing")) %>% ungroup()
arrange(GraduationSentBing, sentiment) -> GradBingTest
sum(GradBingTest$n[1:85])
sum(GradBingTest$n[86:140])
GradSentiment = c("positive", "negative")
GradN = c(246, 413)
GradPercent = c(37, 62)
GradPosNeg <- data.frame(GradSentiment, GradN, GradPercent)
Gradchart <- ggplot(GradPosNeg, aes(x="", y=GradPercent, fill=GradSentiment)) + geom_bar(width = 1, stat = "identity")
GradPie <- Gradchart + coord_polar("y", start=0)
GradPie + blank_theme + theme(axis.text.x=element_blank(), legend.title = element_blank()) + geom_text(aes(y = GradPercent/2 + c(0, cumsum(GradPercent)[-length(GradPercent)]), label = percent(GradPercent/100)), size=5) + ggtitle("Ratio of Positive and Negative Words in Graduation")
My findings can be viewed in the following graphs:
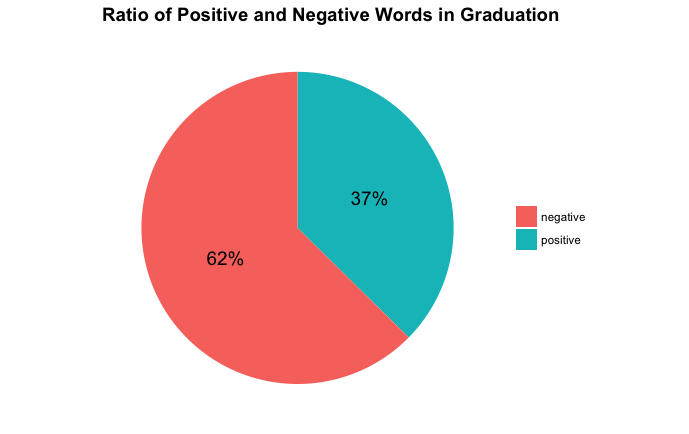
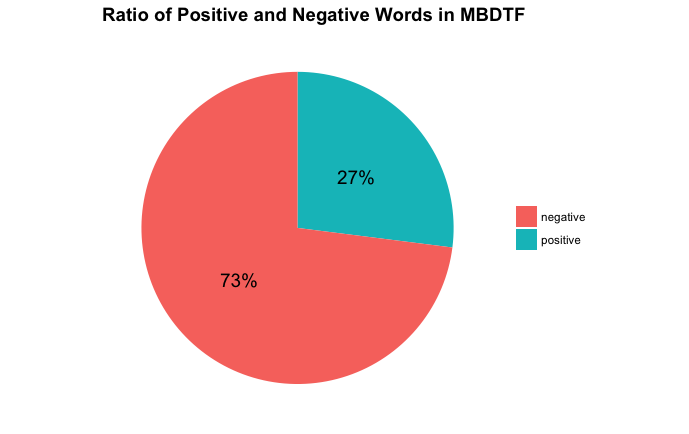
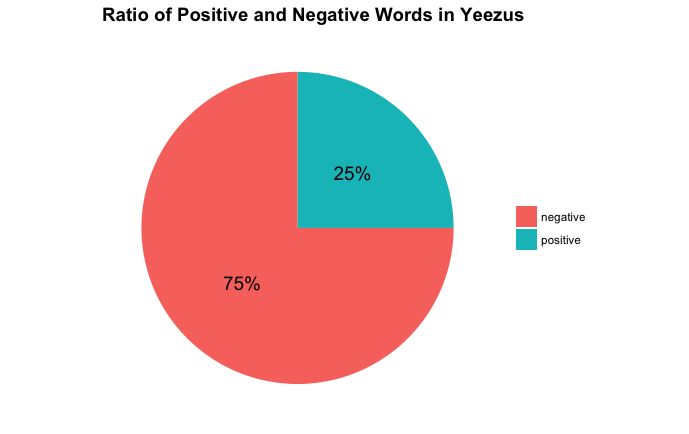
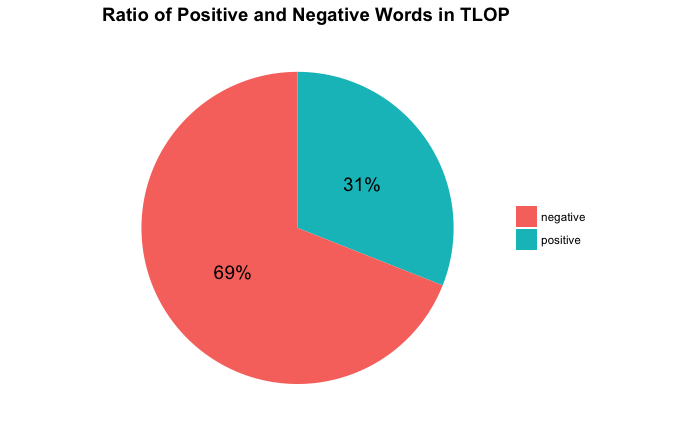
What we can gather from these charts are the compositions of positive and negative words in each album. It is important to judge the albums by relative composition of positive and negative words rather than comparing the mere amount of positive and negative words, as each album is a different length. We can see that Yeezus has the largest composition of negative words compared to the others. It is followed by My Beautiful Dark Twisted Fantasy, The Life of Pablo, then Graduation. This scale partially proves my hypothesis, negativity increases and peaks in Yeezus, yet goes down in The Life of Pablo. However, the bing scale does not take into account how strongly positive or negative a word is, which can make a big difference. This brings us to our next section, sentiment using the afinn scale.
Album Sentiments using Afinn
The afinn sentiment scale is a list of English words rated for valence with an integer between minus five (negative) and plus five (positive). This scale is useful when you want to find how strongly positive or negative a text is, not just by amount of positive/negative words but how strongly positive and negative the words in the text are. I innerjoined the afinn scale with the words from each album, then multiplied the number of each word by the score it received. I then took the total score of all the words and averaged it for the amount of words on the album. With these scores I made a new dataframe and made a bar chart. View my code below (only showing the code for Graduation):
GraduationSentAfinn <- GraduationOrdered %>% inner_join(get_sentiments("afinn")) %>% ungroup()
GraduationSentAfinn <- GraduationSentAfinn %>% mutate(total = n * score)
sum(GraduationSentAfinn$total)
sum(GraduationSentAfinn$n)
Graduationscore = -0.9044444
Score = c(-0.9044444, -1.527273, -2.010169, -0.8947)
Album = c("Graduation", "MBDTF", "Yeezus", "TLOP")
AFinnData <- data.frame(Album, Score)
AFinnChart <- AFinnData %>% ggplot(aes(x = Album, y = Score, fill = Score)) + geom_col(show.legend = FALSE) + ggtitle("Afinn Positivity Score per Album") + ylim(-2.5, 2) + xlab("Album")
My findings can be viewed in the following graph (note that the albums are not in order of time):
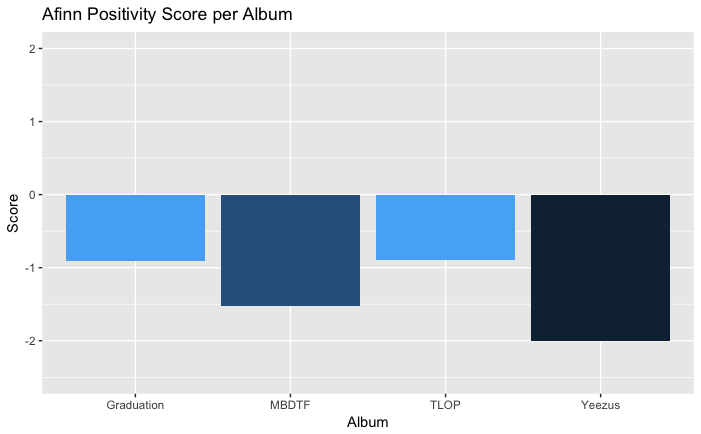
From this graph, we can conclude that negativity increases and peaks once again in Yeezus, then declines again in The Life of Pablo. This finding supports the conclusion from the bing scale.
Album Sentiments using NRC
The NRC sentiment scale rates words for each emotion type as well as a positive or negative valence. The ten sentiments are as follows: "anger", "anticipation", "disgust", "fear", "joy", "sadness", "surprise", "trust", "negative", and "positive." To find the NRC sentiments for Kanye albums I joined the word dataset with the nrc dataset, arranged it by sentiment, then summed up the ammount of words per each sentiment. I then combined all of the album columns with the number of words per emotion together. I then summed the total words in each album and divided each emotion number by the total to find the average of each emotion relative to the album size. I reshaped this dataset from wide to long using the "reshape2" package, then plotted it with a bar graph. View my code below (only showing the code for Graduation):
GraduationSentNRC <- GraduationOrdered %>% inner_join(get_sentiments("nrc")) %>% ungroup()
arrange(GraduationSentNRC, sentiment) -> GraduationNRCTest
GraduationNRCsum <- aggregate(GraduationNRCTest$n, by=list(sentiment=GraduationNRCTest$sentiment), FUN=sum)
AlbumsNRC <- GraduationNRCsum %>% inner_join(MBDTFNRCsum) %>% ungroup()
colnames(AlbumsNRC) <- c("sentiment", "Graduation", "MBDTF", "Yeezus", "TLOP")
# sum number of words and divide by each emotion
sum(AlbumsNRC$Graduation)
Graduationtotalwords = 1584AlbumsNRC <- AlbumsNRC %>% mutate(Graduation = Graduation / Graduationtotalwords)
library("reshape2")
test_data_long <- melt(AlbumsNRC, id="sentiment") # convert to long format
ggplot(data=test_data_long, aes(x=variable, y=value, fill=sentiment)) + geom_col(position = "dodge") + ggtitle("NRC Sentiment per each Kanye West Album") + labs(x = "Album")
This gave me the following chart:
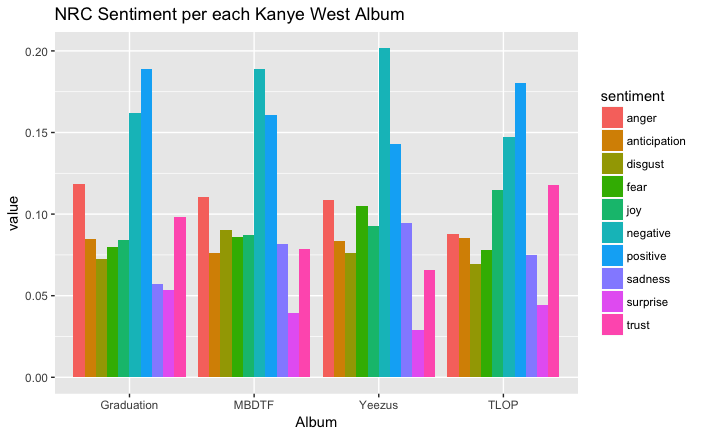
What we can conclude from this graph is that negativity again increases and peaks in Yeezus, then declines in The Life of Pablo. Anger mildly decreases which each album, fear increases slightly until Yeezus, and declines in The Life of Pablo. Suprise decreases slightly hitting its lowest point in Yeezus, then increases in The Life of Pablo. Joy slightly increases mildly which each album, peaking in The Life of Pablo. Other sentiments don't show any notable correlation with album progression.
What does this mean?
My hypothesis was only partially proved, that negativity, along with fear, increases in West's lyrics, peaking in Yeezus, then decreasing in The Life of Pablo. Suprise also hits a low point in Yeezus, this could be due to the fact that Yeezus deals a lot with topics of slavery and racism, which could be attributed to a lack of suprise with, or expectation of racism in the life of the artist. This is most likely also the reason that negativity and fear peaks in Yeezus.