Prediction: the four most followed people on twitter will have relatively similar Twitter activity.
For this project, I chose to analyze the accounts of the four most followed twitter accounts. As of 11/29/16, the four most followed people on Twitter are: @katyperry, @justinbieber, @taylorswift13 and @BarackObama. I am looking to see how similar or different their Twitter activity is.
Twitter Activity
Before we understand how people tweet or what they tweet about, we must understand how often they tweet. To understand how the four most followed people on Twitter tweet, I used the TwitteR package to analyze the timeline of their most recent 1,000 tweets. I visualized the activity using the calendar heat function.
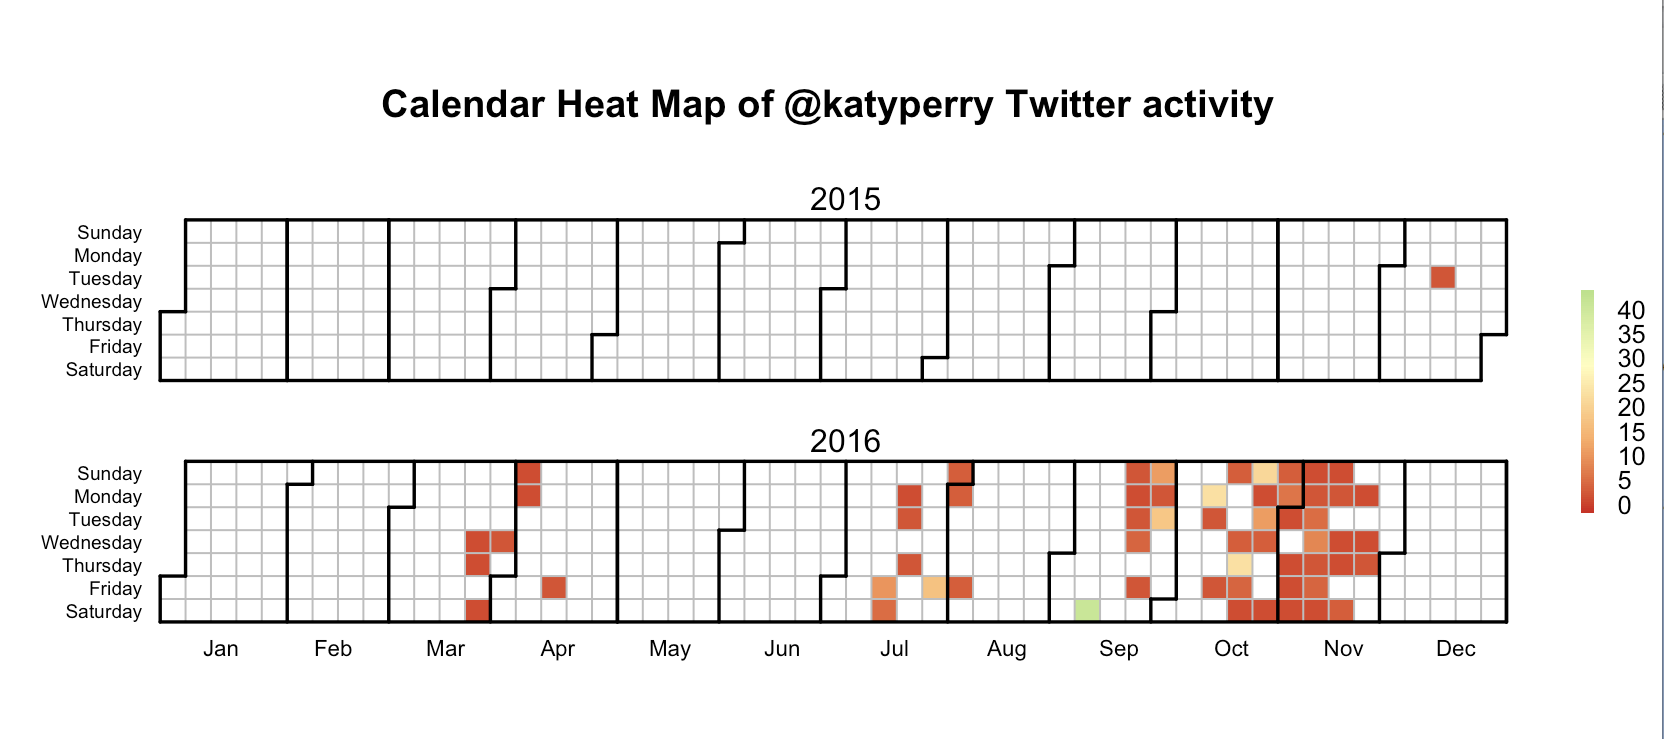
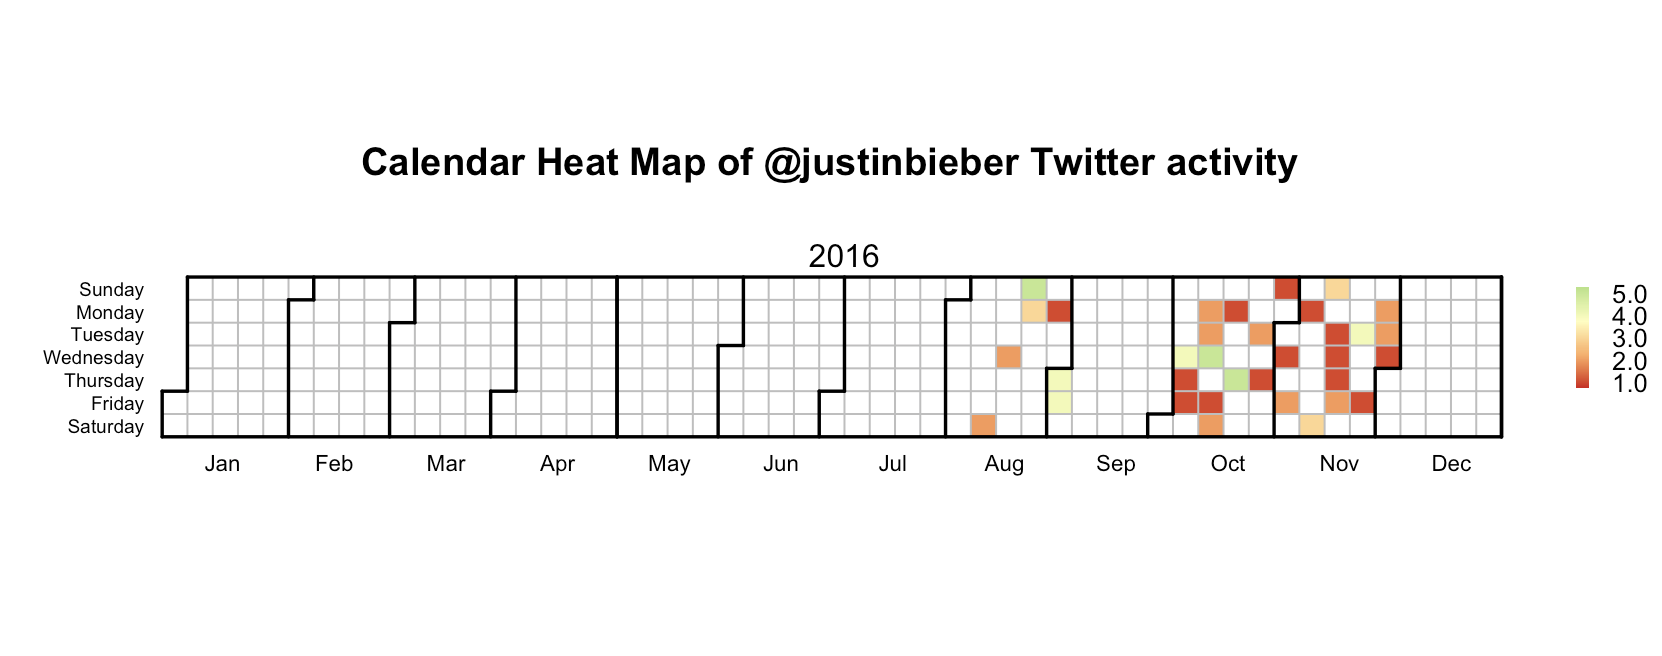
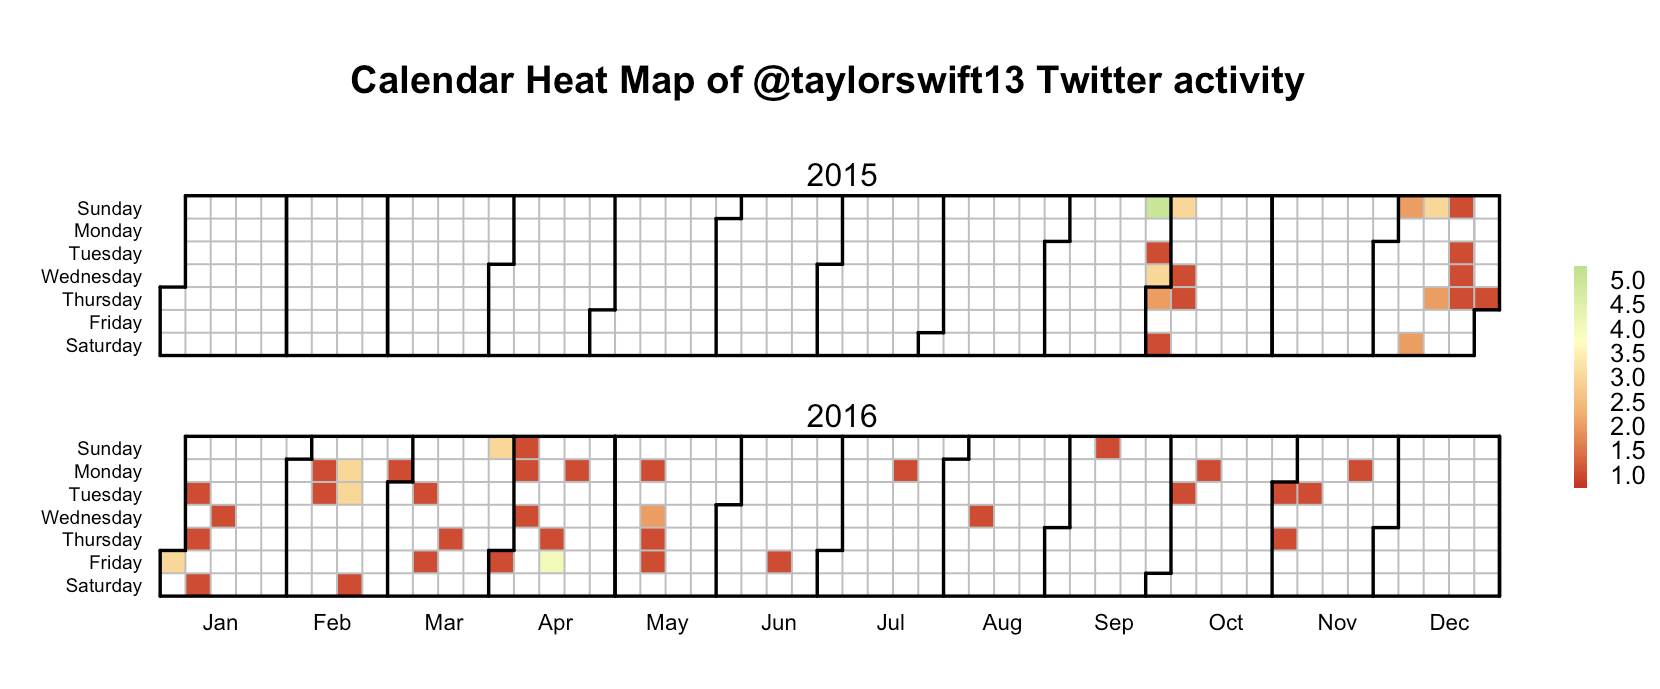
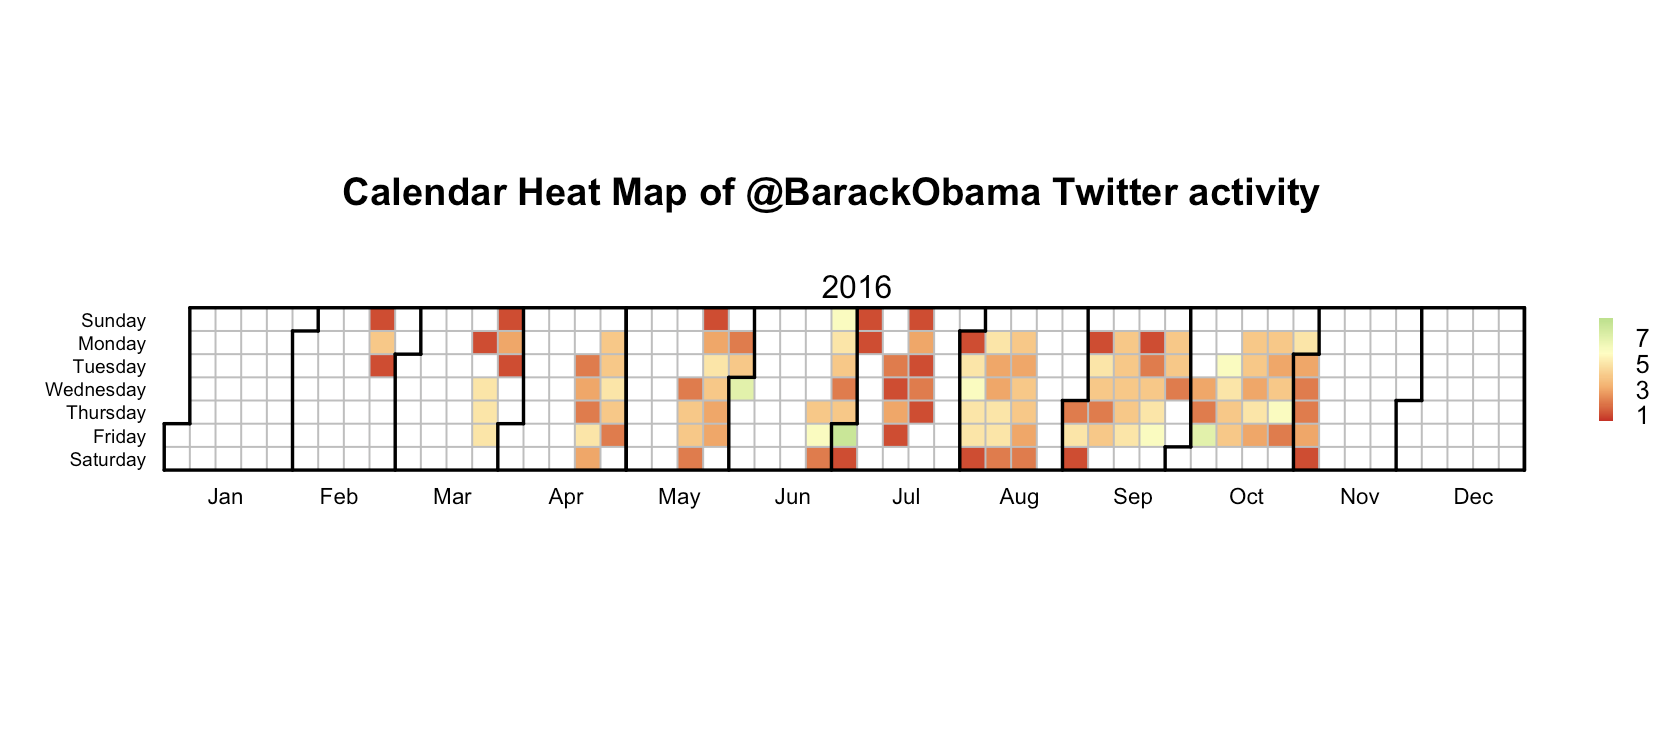
In this analysis we see that the Twitter activity in users vary. One point of interest is the maximum number of tweets in one day. For example, @katyperry tweeted 40 times in one day, but @justinbieber and @taylorswift13's maximum number of tweets in one day was 5. This analysis spans each user's most 1,000 tweets so we can see how long it takes to trace back their most 1,000 tweets. @BarackObama seems to tweet fairly often with a very distributed spread of the tweets. However, @katyperry often does not tweet for months on end, but when she does she tweets very often.
mht=userTimeline('taylorswift13',n=1000)
tw.df=twListToDF(mht)
trim <- function (x) sub('@','',x) tw.df$rt=sapply(tw.df$text,function(tweet) trim(str_match(tweet,"^RT (@[[:alnum:]_]*)")[2])) tw.df$rtt=sapply(tw.df$rt,function(rt) if (is.na(rt)) 'T' else 'RT') tw.dfs=subset(tw.df,subset=((Sys.time()-created)<8000)) tw.dfx=ddply(tw.dfs, .var = "replyToSN", .fun = function(x) {return(subset(x, created %in% min(created),select=c(replyToSN,created)))}) tw.dfxa=arrange(tw.dfx,-desc(created)) tw.dfs$replyToSN=factor(tw.dfs$replyToSN, levels = tw.dfxa$replyToSN)
#label a tweet with the month number tw.dfs$month=sapply(tw.dfs$created, function(x) {p=as.POSIXlt(x);p$mon}) #label a tweet with the hour tw.dfs$hour=sapply(tw.dfs$created, function(x) {p=as.POSIXlt(x);p$hour}) #label a tweet with a number corresponding to the day of the week tw.dfs$wday=sapply(tw.dfs$created, function(x) {p=as.POSIXlt(x);p$wday})
ts=xts(rep(1,times=nrow(tw.dfs)),tw.dfs$created) ts.sum=apply.daily(ts,sum) ts.sum.df=data.frame(date=index(ts.sum), coredata(ts.sum)) colnames(ts.sum.df)=c('date','sum')
calendarHeat(ts.sum.df$date, ts.sum.df$sum, varname="@taylorswift13 Twitter activity")
Hashtags
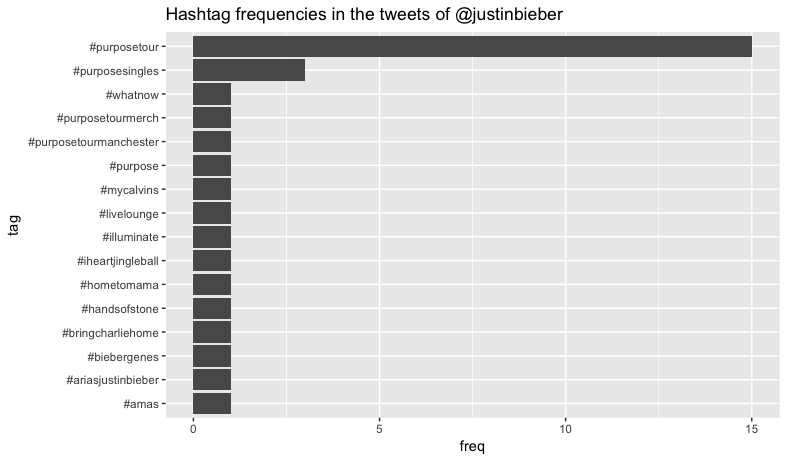
The hashtag is Twitter's most distinguishing feature. Understanding how these accounts use Twitter is crucial to understanding the similarity of their accounts. To understand how the four most followed people on Twitter used hashtags I used the TwitteR package to analyze their 1,000 most recent tweets.
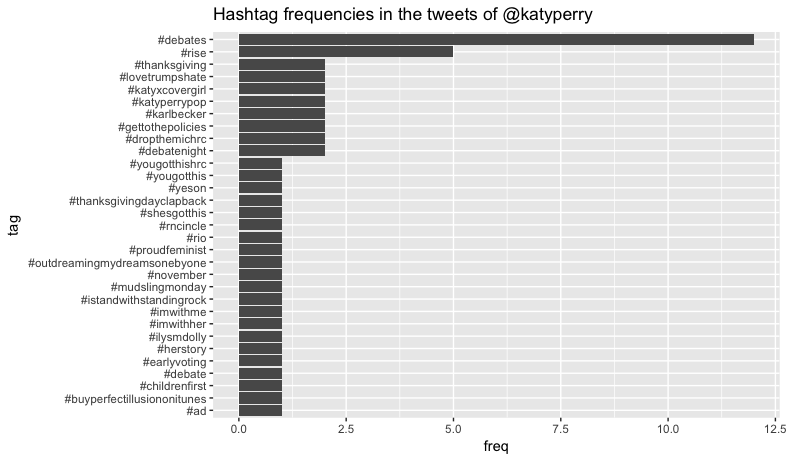
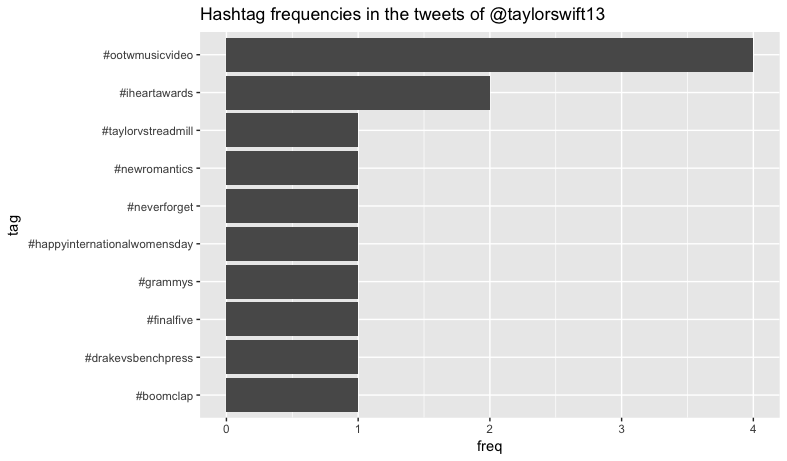
This analysis showed differing use in both how often Twitter hashtags were used and what the hashtags were about. We see that @taylorswift13 hardly uses hashtags but when she does they relate directly to her industry. However, @katyperry uses hashtags very frequently that do not necessarily relate to her industry. Katy Perry appears to be a very political twitter user with many hashtags about the presidential election and Dakota pipeline.
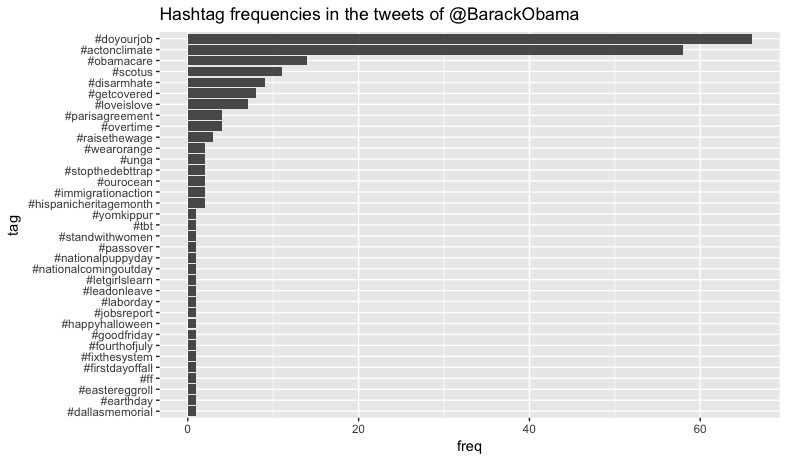
tw = userTimeline("BarackObama", n = 1000)
tw = twListToDF(tw) vec1 = tw$text extract.hashes = function(vec){ hash.pattern = "#[[:alpha:]]+" have.hash = grep(x = vec, pattern = hash.pattern) hash.matches = gregexpr(pattern = hash.pattern, text = vec[have.hash]) extracted.hash = regmatches(x = vec[have.hash], m = hash.matches)
df = data.frame(table(tolower(unlist(extracted.hash)))) colnames(df) = c("tag","freq") df = df[order(df$freq,decreasing = TRUE),] return(df) } dat = head(extract.hashes(vec1),50) dat2 = transform(dat,tag = reorder(tag,freq)) View(dat2)
p = ggplot(dat2, aes(x=tag, y = freq)) + geom_bar(stat="identity") p + coord_flip() + labs(title = "Hashtag frequencies in the tweets of @BarackObama")